Transforming ece Policy data

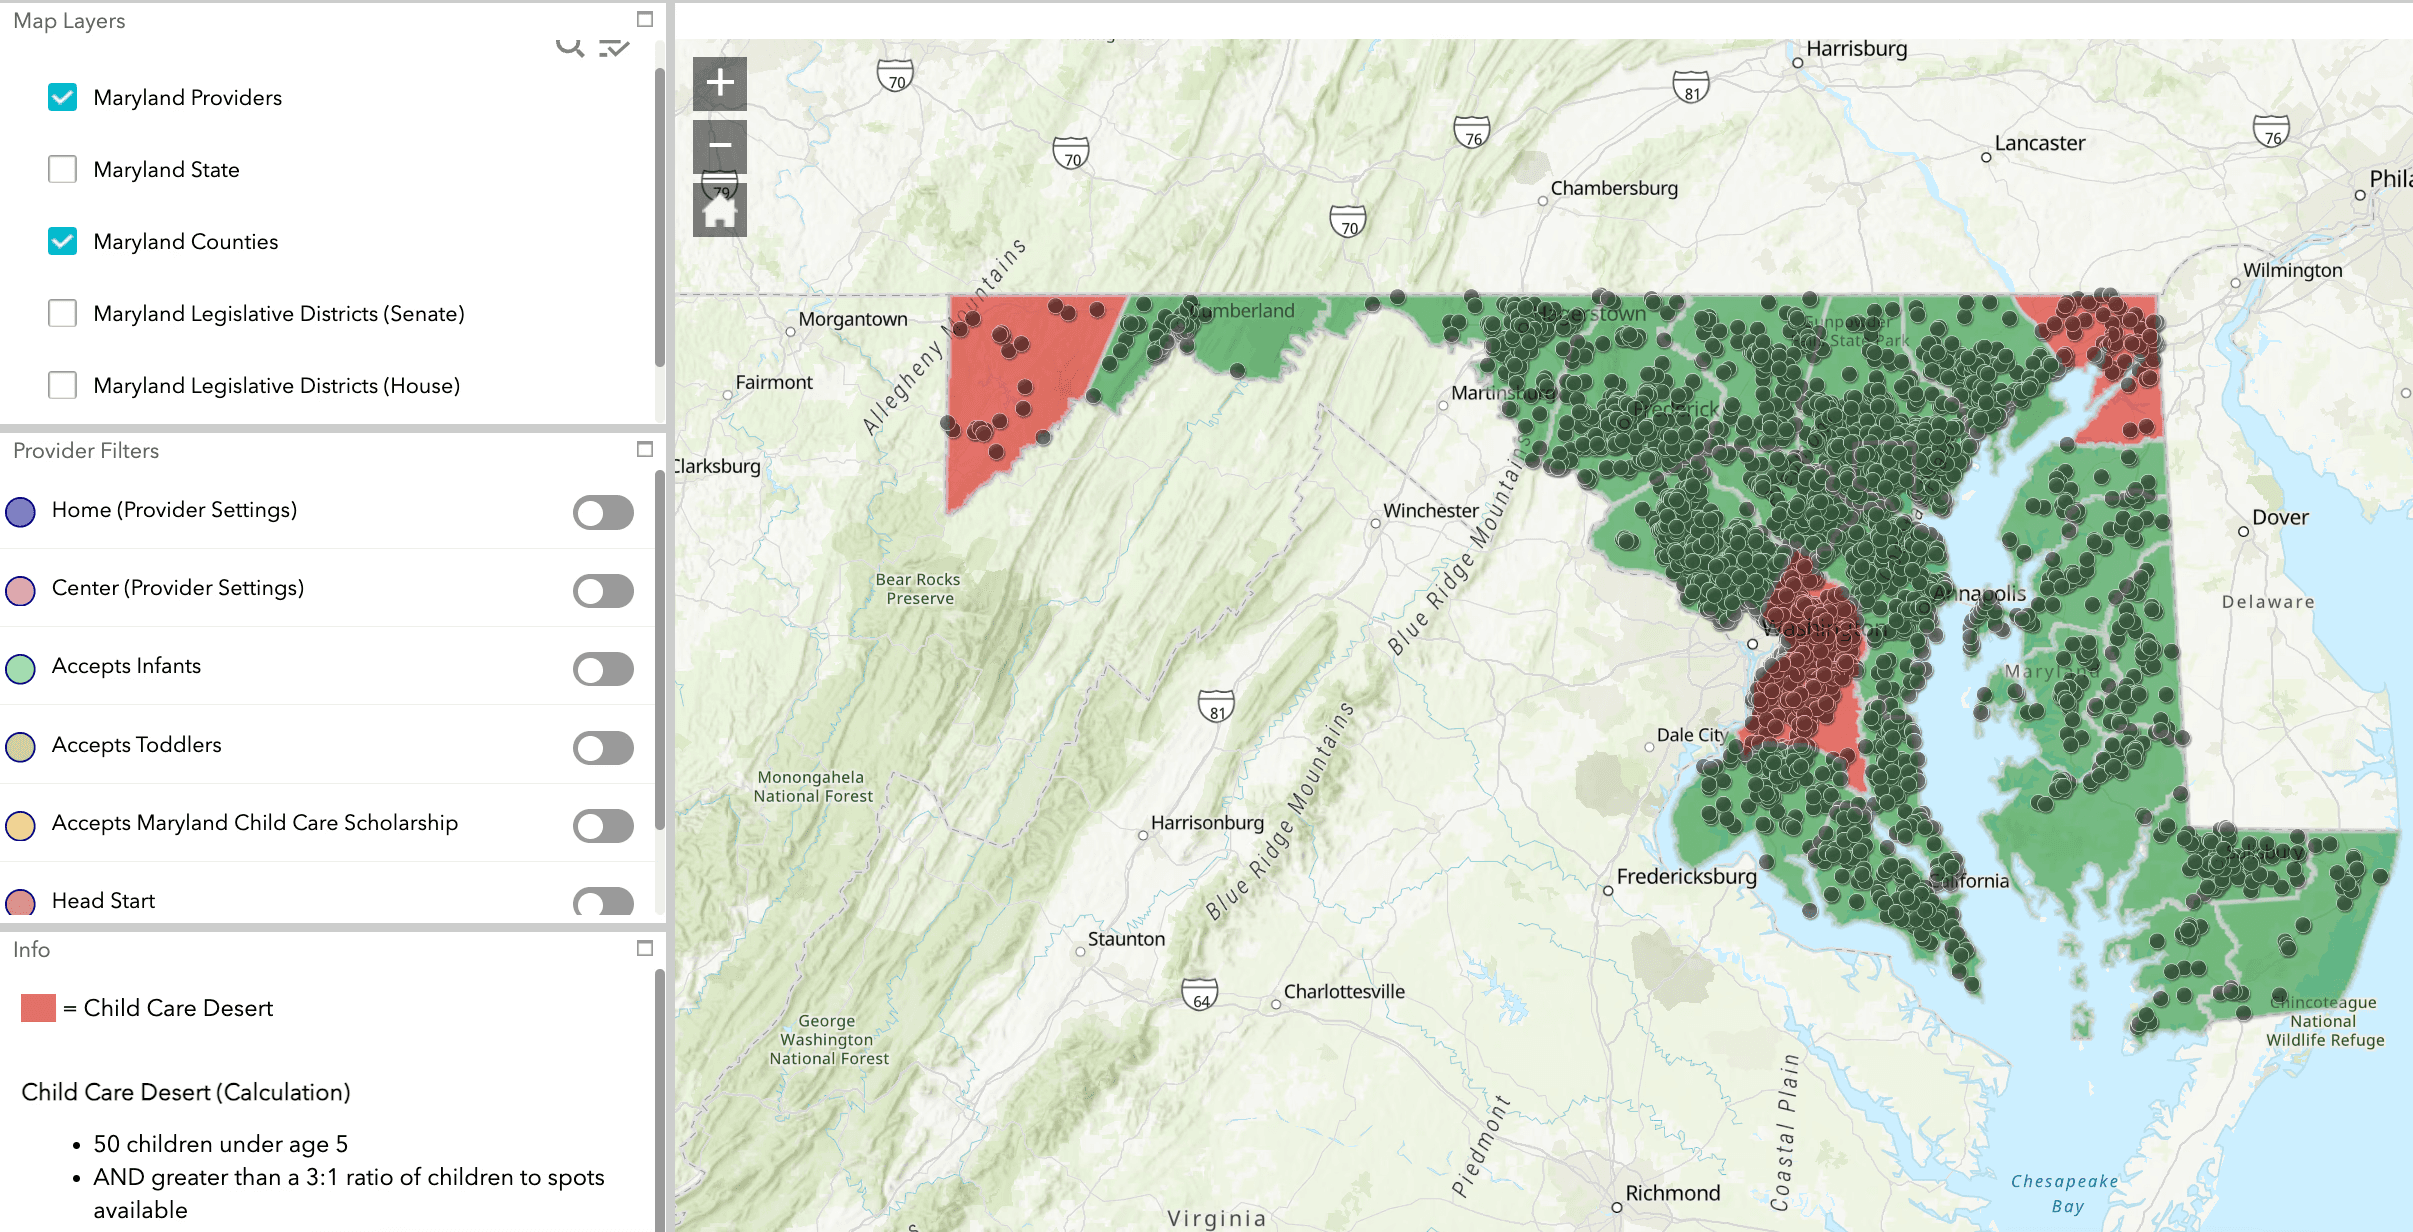
Real-Time Childcare Desert Maps

Visualize Supply and Demand Gaps

Introducing the first real-time childcare desert maps showing supply and demand gaps across every program type and geographical areas.

Consolidated Provider Data

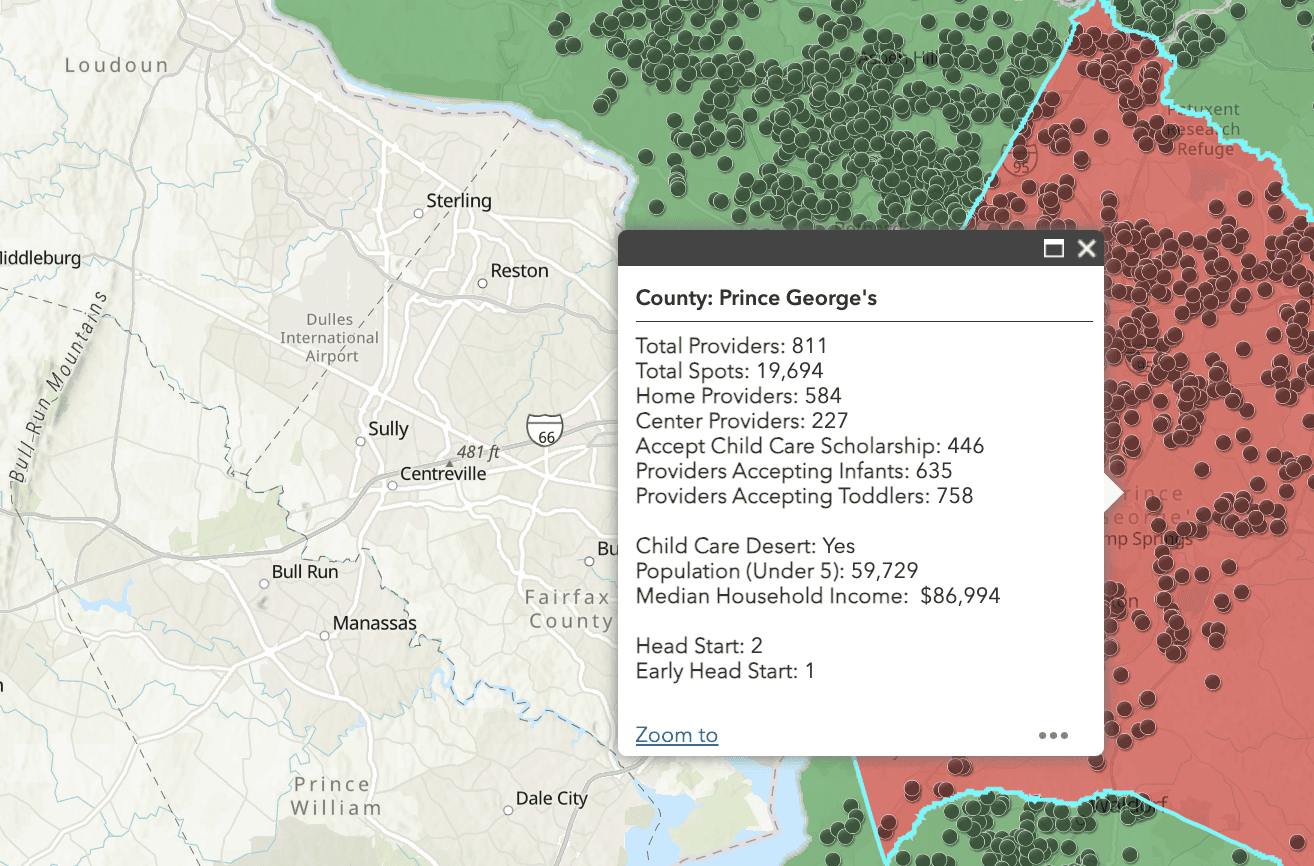
Consolidate every data source such as Licensing, Quality, Provider Data, and CCMS into a single database for a comprehensive view of Childcare Supply.

Visualizing Supply vs. Demand

Visualizing Supply vs. Demand

Visualize of childcare programs in relation to the number of children to shape policy decisions and identify areas needing investment.


Identify:

  • Affordability gaps with Average Cost of Care for every region

  • Quality gaps with color coded provider mapping

  • Infant/Toddler gaps with program filters

Five Maps in One

Detailed visualizations and calculations across multiple geographical areas:

  • State

  • County Level

  • Congressional Districts

  • Legislative Districts- Senate

  • Legislative Districts- House

  • Census Tracts

  • Quality Regions


Detailed visualizations and calculations across multiple geographical areas:

  • State

  • County Level

  • Congressional Districts

  • Legislative Districts- Senate

  • Legislative Districts- House

  • Census Tracts

  • Quality Regions

Learn how Maryland doubled the number of families accessing childcare

Let's Talk ECE Data!

Let's Talk ECE Data!

Let's Talk ECE Data!

Let's Talk ECE Data!

Learn how Maryland doubled the number of families accessing childcare